Annual gross income in the EU: growth, gaps and catch-up since 2005
This page tracks average annual gross employee income across European Union countries from 2005 to 2024. Over these two decades, incomes rose almost everywhere — but the pace differed sharply. The result is a changing map of the EU where some countries steadily expanded, while others experienced fast “catch-up” growth and moved up the ranking.
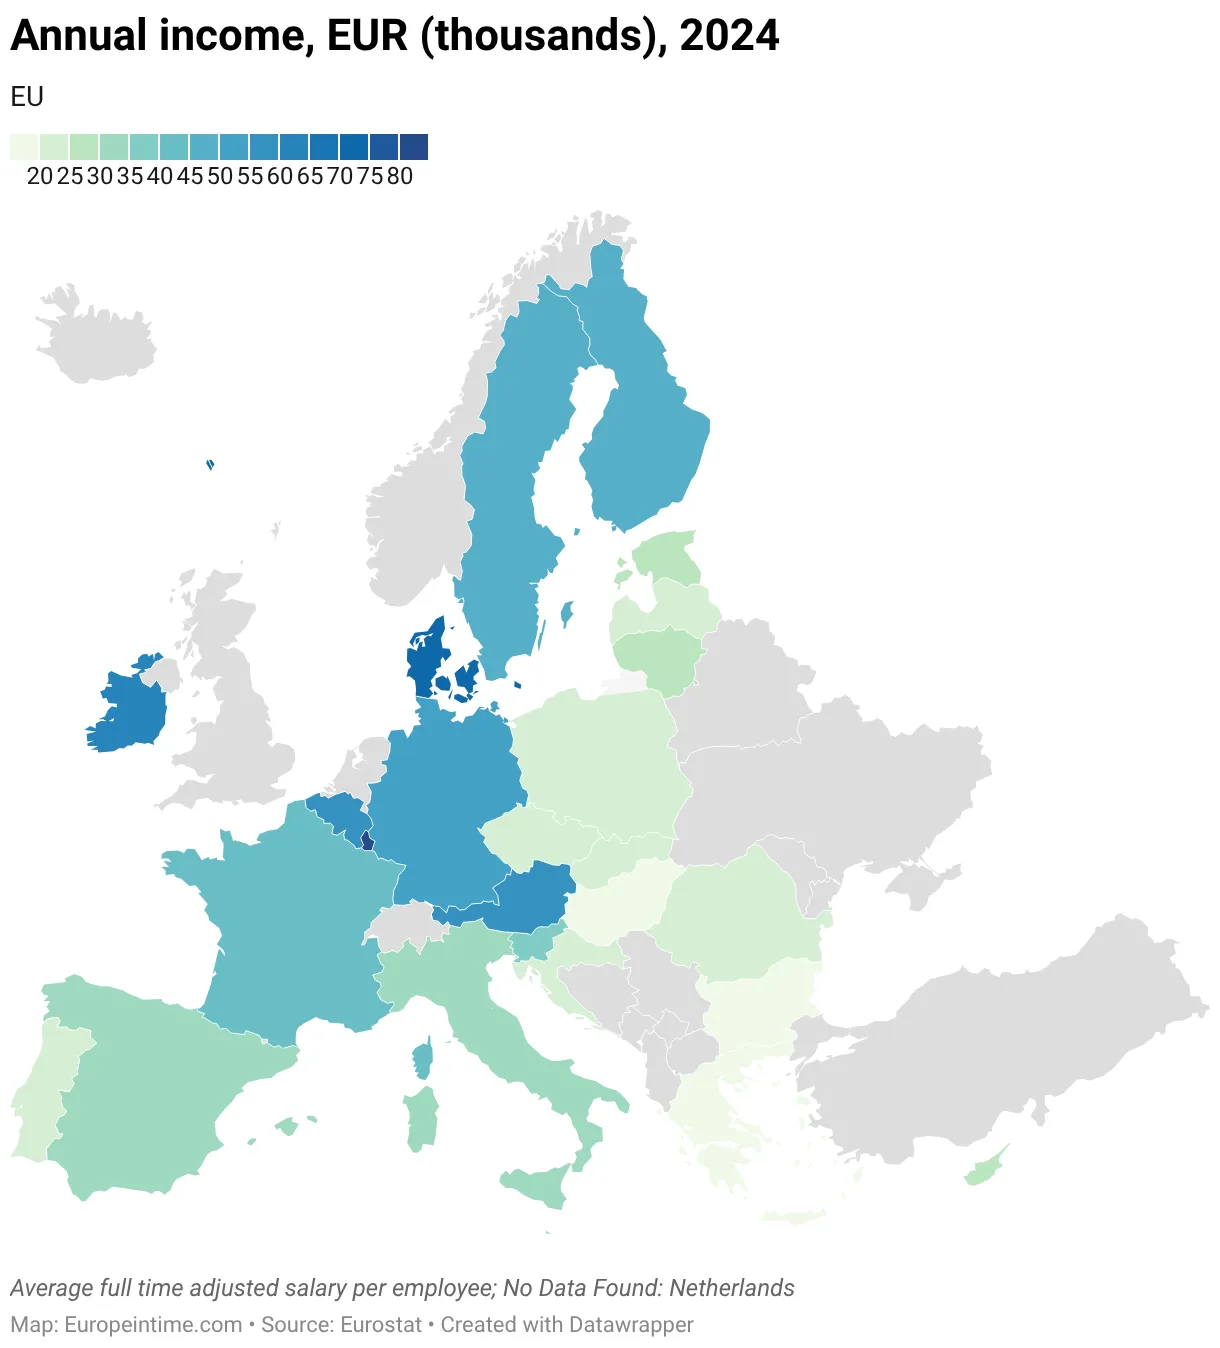
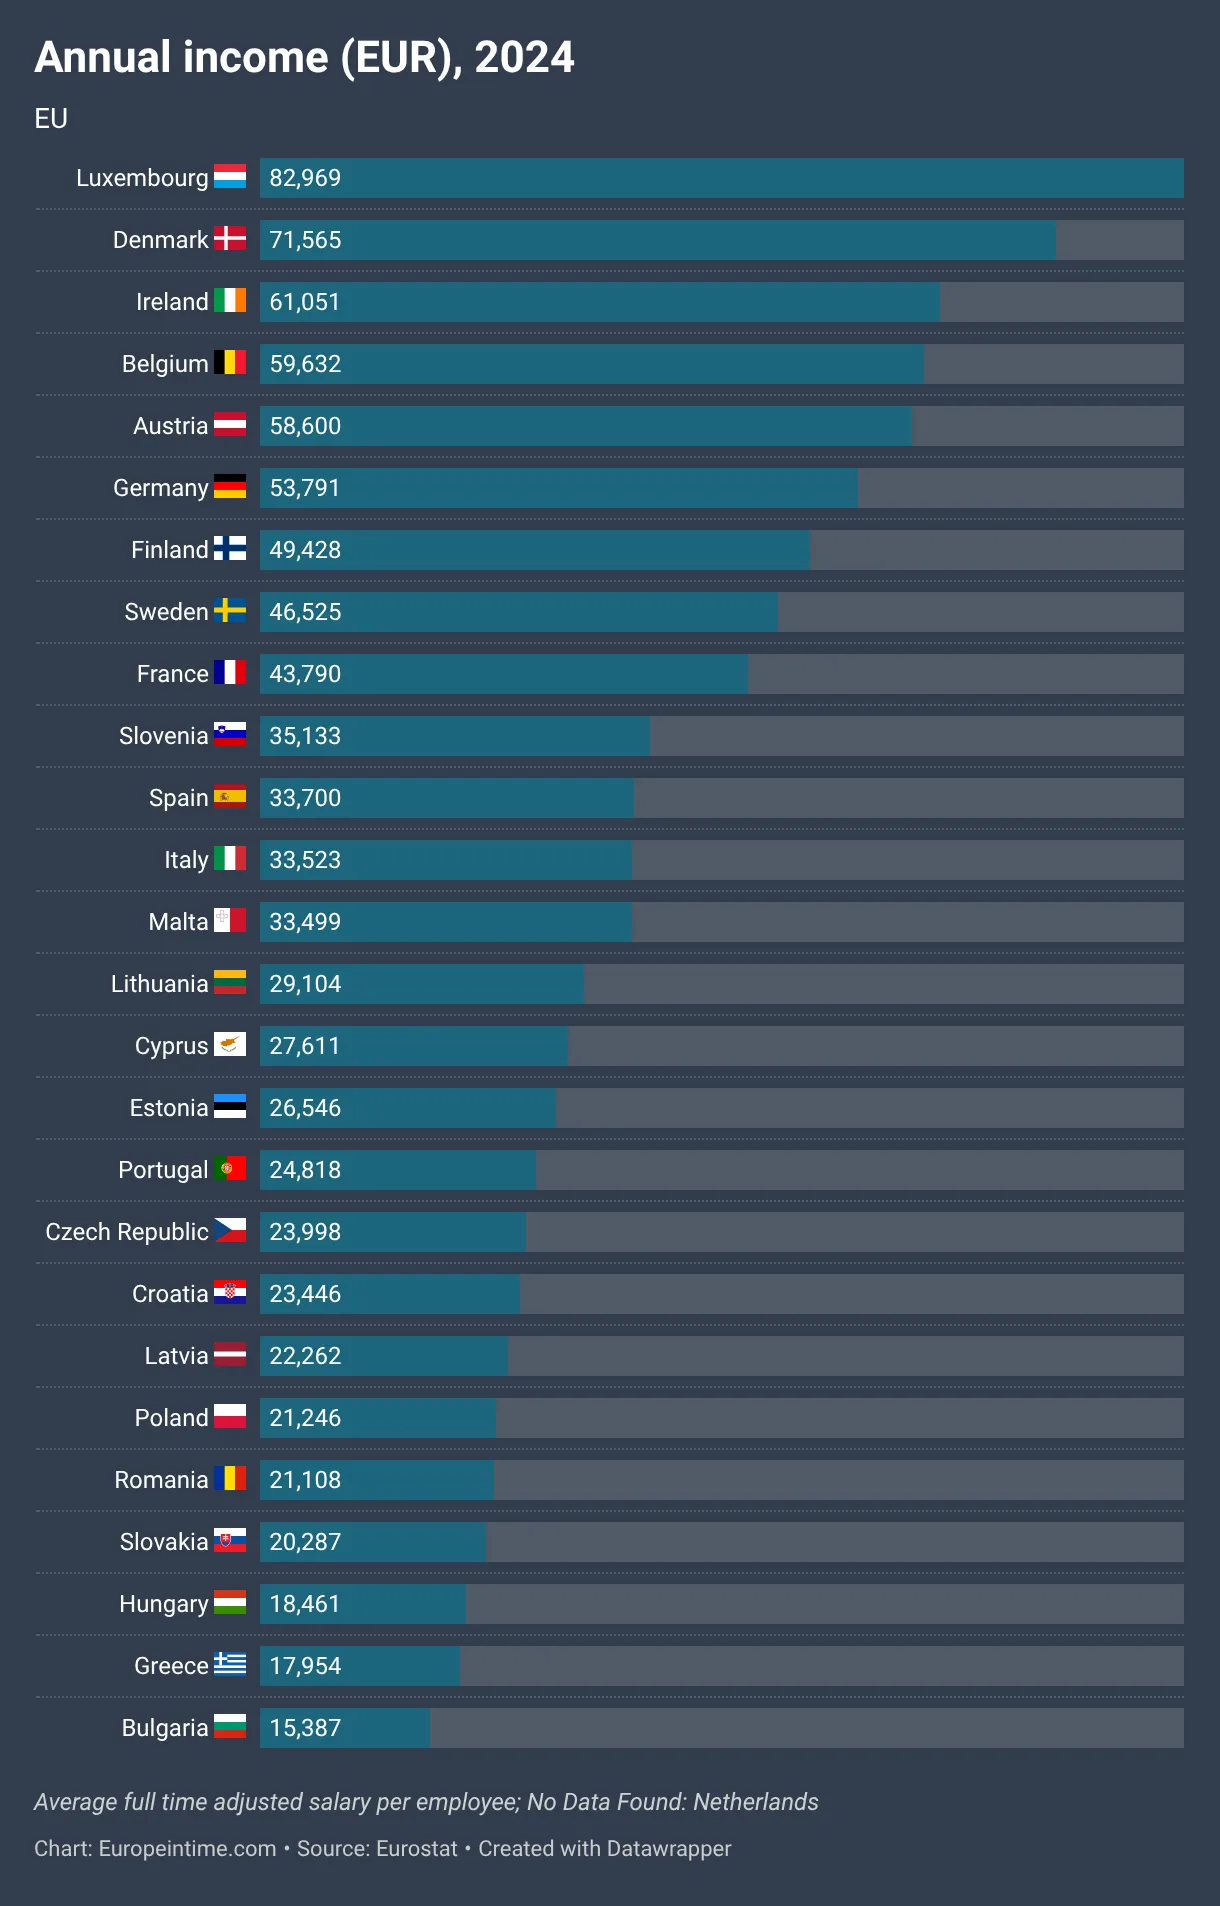
To make the patterns easy to explore, the page offers three complementary views. Current map shows the latest available year at a glance. Current table gives exact values country by country. And time series visualizes the full history — letting you see when countries accelerate, slow down, and overtake each other.
Extended analysis
What the data measures
The indicator used here is average annual gross income of employees (EUR) across European Union (EU) countries. “Gross” means before taxes and social contributions. Because tax systems differ widely, gross income is a strong choice for cross-country comparability — but it should not be interpreted as disposable (“take-home”) income.
1) The long-term trend: rising incomes, but unevenly across the EU
From 2005 to 2024, average gross annual employee income increased across nearly all EU countries. The key difference is how fast. Some countries grew steadily from an already high base, while others started lower and grew rapidly — closing part of the gap within the Union.
The time series view is particularly useful here: it shows that “catch-up” is not always smooth. Countries can surge during certain periods, plateau later, and sometimes be temporarily overtaken by peers.
2) Convergence: the biggest relative gains are in Central and Eastern EU countries
The most pronounced growth is concentrated in Central and Eastern EU member states — countries that started from lower income levels in 2005 and then expanded quickly over the next two decades.
In the dataset, the strongest percentage increases between 2005 and 2024 are observed in: Bulgaria (+474 %), Romania (+399 %), Lithuania (+395 %), Latvia (+297 %), Estonia (+289 %), Slovakia (+228 %), Czech Republic (+189 %) and Poland (+183 %)
This is one of the clearest messages of the visualization: the EU has not only grown richer overall, but parts of the Union have also narrowed the income gap through sustained faster growth.
3) Slower-growth countries: when the EU ranking barely moves
A different pattern appears in several EU countries where long-term growth is comparatively modest. In these cases, positions in the ranking tend to be stable.
In this dataset, the weakest long-term growth includes: Greece (an outlier with little long-term improvement over the full period, -1 %), Italy (+35 %) and several mature high-income EU economies where growth is steady but slower relative to the fastest-growing members.
For interpretation, it helps to remember that percentage growth depends on the starting point: a country beginning at a higher level can grow substantially in absolute terms while still showing a smaller percentage increase.
4) The 2020 disruption and subsequent recovery within the EU
A visible feature in many country trajectories is the short-term shock around 2020, followed by recovery. Even when the long-term trend is upward, the time series shows that incomes can dip temporarily and then rebound — and that the shape of the recovery differs by country.
If you want to understand how the latest EU ranking was formed, this is a key period to watch: countries with a stronger post-2020 rebound often regain or improve their position, while others take longer to return to trend.
Archive of maps and tables