Exchange rates in Europe: stability, volatility and long-term shifts since 2000
This page tracks annual average exchange rates between the euro (EUR) and selected European currencies from 2000 to 2025. While some currencies have remained tightly aligned with the euro, others experienced substantial appreciation or depreciation over time.
The euro serves as a useful benchmark: it is used by most EU member states and functions as a reference currency in the European single market. Comparing national currencies against the euro reveals differences in monetary regimes, economic shocks and long-term macroeconomic stability.
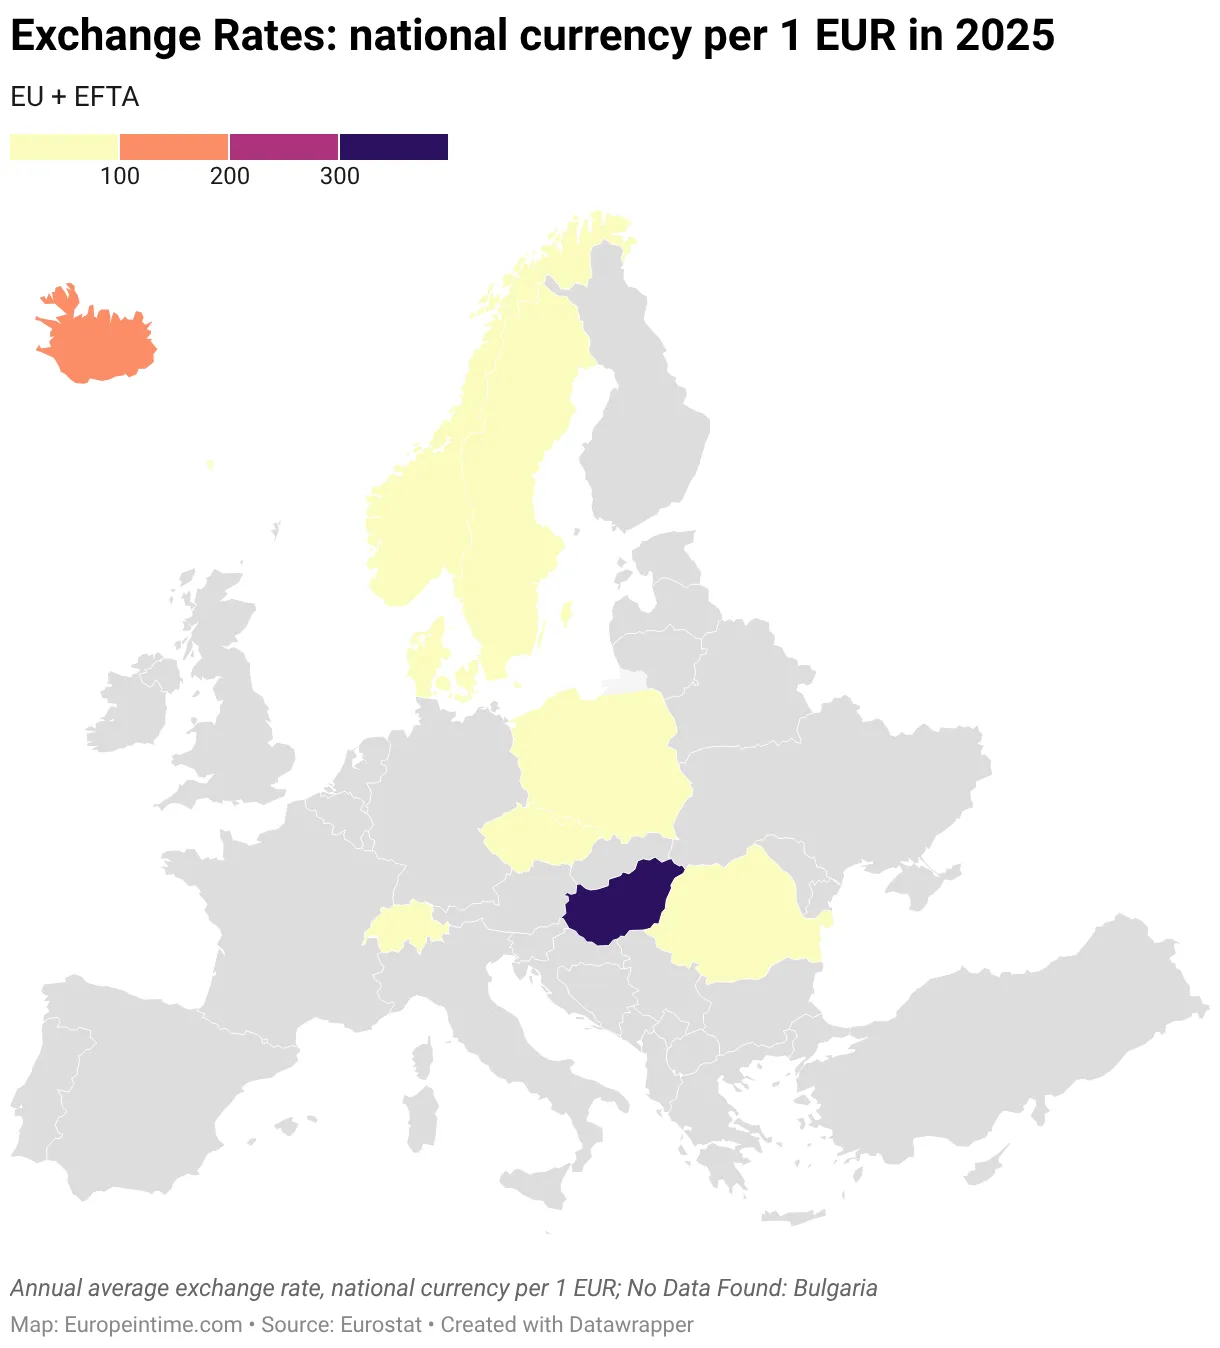
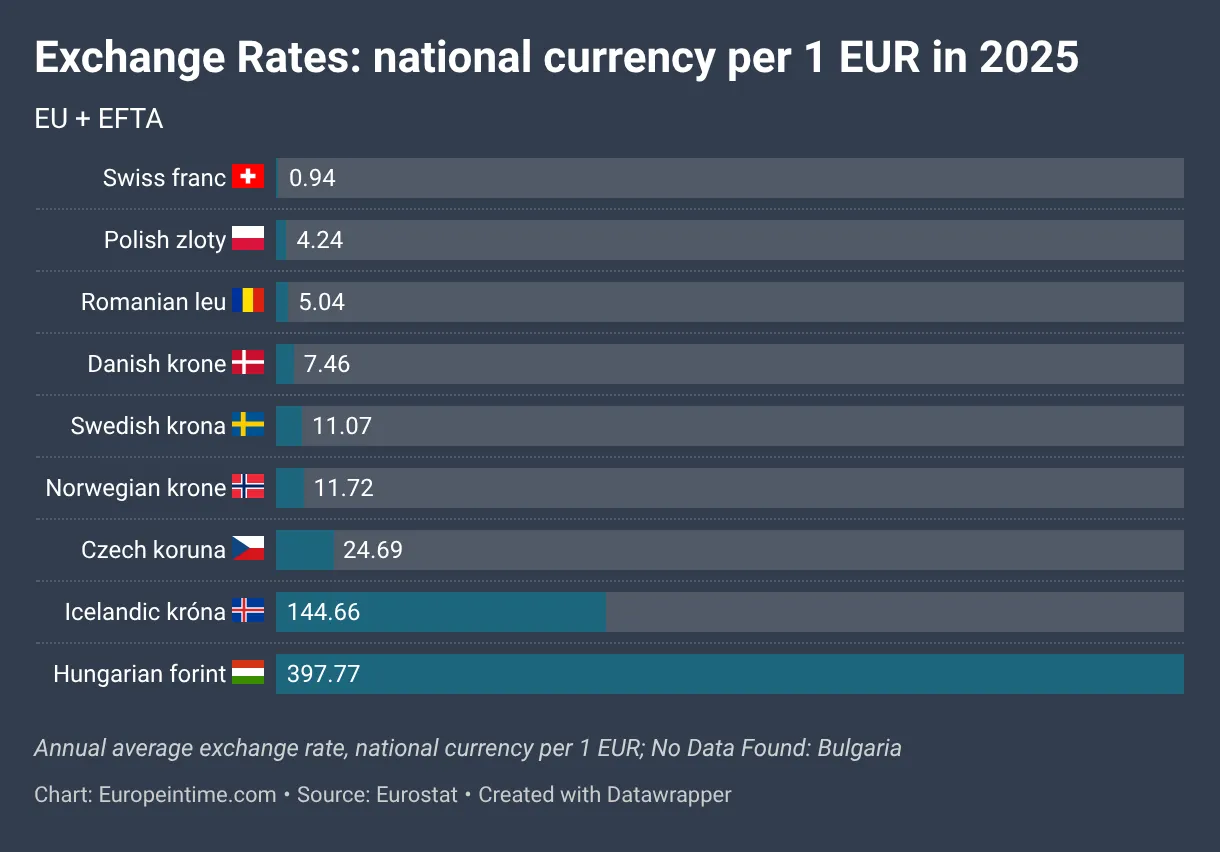
To make the patterns easy to explore, the page offers three complementary views. Current map shows the latest available exchange rate. Current table lists exact annual averages. And time series visualizes the full historical evolution from 2000 onward — highlighting volatility, turning points and structural shifts.
Extended analysis
What the data measures
The dataset shows annual average exchange rates of national currencies against the euro (EUR). Values represent how many units of local currency equal one euro. Higher values indicate a weaker currency relative to the euro.
1) Fixed vs floating regimes in Europe
Not all European currencies behave the same way. Denmark maintains a tightly managed exchange rate within ERM II, while Bulgaria operates a currency board arrangement historically pegged to the euro. These systems result in very limited fluctuations over time.
By contrast, currencies such as the Hungarian forint, Polish złoty or Czech koruna operate under more flexible regimes, leading to more visible appreciation and depreciation cycles.
2) Long-term depreciation patterns
Several Central and Eastern European currencies show gradual long-term depreciation against the euro since the early 2000s. This reflects inflation differentials, productivity convergence dynamics and monetary policy autonomy.
3) The Swiss franc as a stability benchmark
Among non-euro currencies, the Swiss franc stands out for its long-term strength and safe-haven role. Periods of financial stress — including the global financial crisis and eurozone sovereign debt crisis — were associated with franc appreciation.
4) Crisis episodes and volatility spikes
Exchange rate trajectories reveal distinct volatility episodes around 2008–2009, 2012 (eurozone crisis), 2020 (pandemic shock) and 2022–2023 (inflation and energy crisis). The time series view makes these turning points particularly visible.
5) Why exchange rates matter
Exchange rates influence inflation, trade competitiveness, wage comparisons and cross-border investment flows. For countries outside the euro area, currency movements remain a central macroeconomic adjustment mechanism.
6) Which countries are excluded and why
The visualization focuses on EU and EFTA countries that use a national currency distinct from the euro. Countries that have adopted the euro are excluded, as their exchange rate against EUR is permanently fixed at 1. Including them would not add analytical value.
Liechtenstein is also not shown separately. Although it is a member of EFTA, it uses the Swiss franc (CHF) under a formal monetary union with Switzerland. Its exchange rate is therefore identical to the Swiss franc and does not represent an independent currency trajectory.
The goal of the dataset is to compare independent currency paths within the European economic space, highlighting differences in monetary regimes, flexibility and long-term stability.
Exchange Rate Volatility (EUR vs National Currency, 2000–2025)
Exchange rate volatility reflects how much a currency fluctuates over time. Higher volatility indicates greater sensitivity to financial cycles, external shocks, and flexible exchange rate regimes. The table below ranks European currencies by long-term volatility relative to the euro, based on annual averages from 2000–2025.
Currencies operating under tightly managed regimes — such as Denmark — display extremely low volatility. Floating currencies, particularly in Central and Eastern Europe, show greater dispersion reflecting exposure to global financial cycles and structural convergence processes.
| Currency | Average rate | Min | Max | Total change (since 2000) | Volatility level |
|---|---|---|---|---|---|
| Icelandic króna (ISK) | 146.2 | 72.5 | 186.3 | ↓ 99.3% depreciation | Very High (28.6%) |
| Romanian leu (RON) | 3.96 | 1.96 | 4.97 | ↓ 153.1% depreciation | High (20.4%) |
| Hungarian forint (HUF) | 291.5 | 230.0 | 430.0 | ↓ 53.0% depreciation | High (16.8%) |
| Swiss franc (CHF) | 1.29 | 1.00 | 1.68 | ↑ 39.9% appreciation | High (14.9%) |
| Norwegian krone (NOK) | 8.96 | 7.21 | 12.73 | ↓ 44.4% depreciation | Moderate (12.5%) |
| Czech koruna (CZK) | 26.7 | 23.3 | 35.6 | ↑ 30.6% appreciation | Moderate (9.8%) |
| Swedish krona (SEK) | 9.42 | 8.23 | 11.64 | ↓ 31.0% depreciation | Low (8.6%) |
| Polish złoty (PLN) | 4.21 | 3.20 | 4.90 | ↓ 5.8% depreciation | Low (6.3%) |
| Danish krone (DKK) | 7.45 | 7.43 | 7.47 | ↓ 0.13% depreciation | Very Low (0.17%) |
Volatility is measured using the coefficient of variation (CV), calculated as standard deviation divided by the mean of annual average exchange rates (2000–2025).
Archive of maps and tables