Unemployment in Europe: crisis peaks, recovery paths and labour market stability
This page tracks annual unemployment rates across European Union and EFTA countries from 2010 to 2024. Unemployment reflects both short-term economic shocks and deeper structural characteristics of national labour markets.
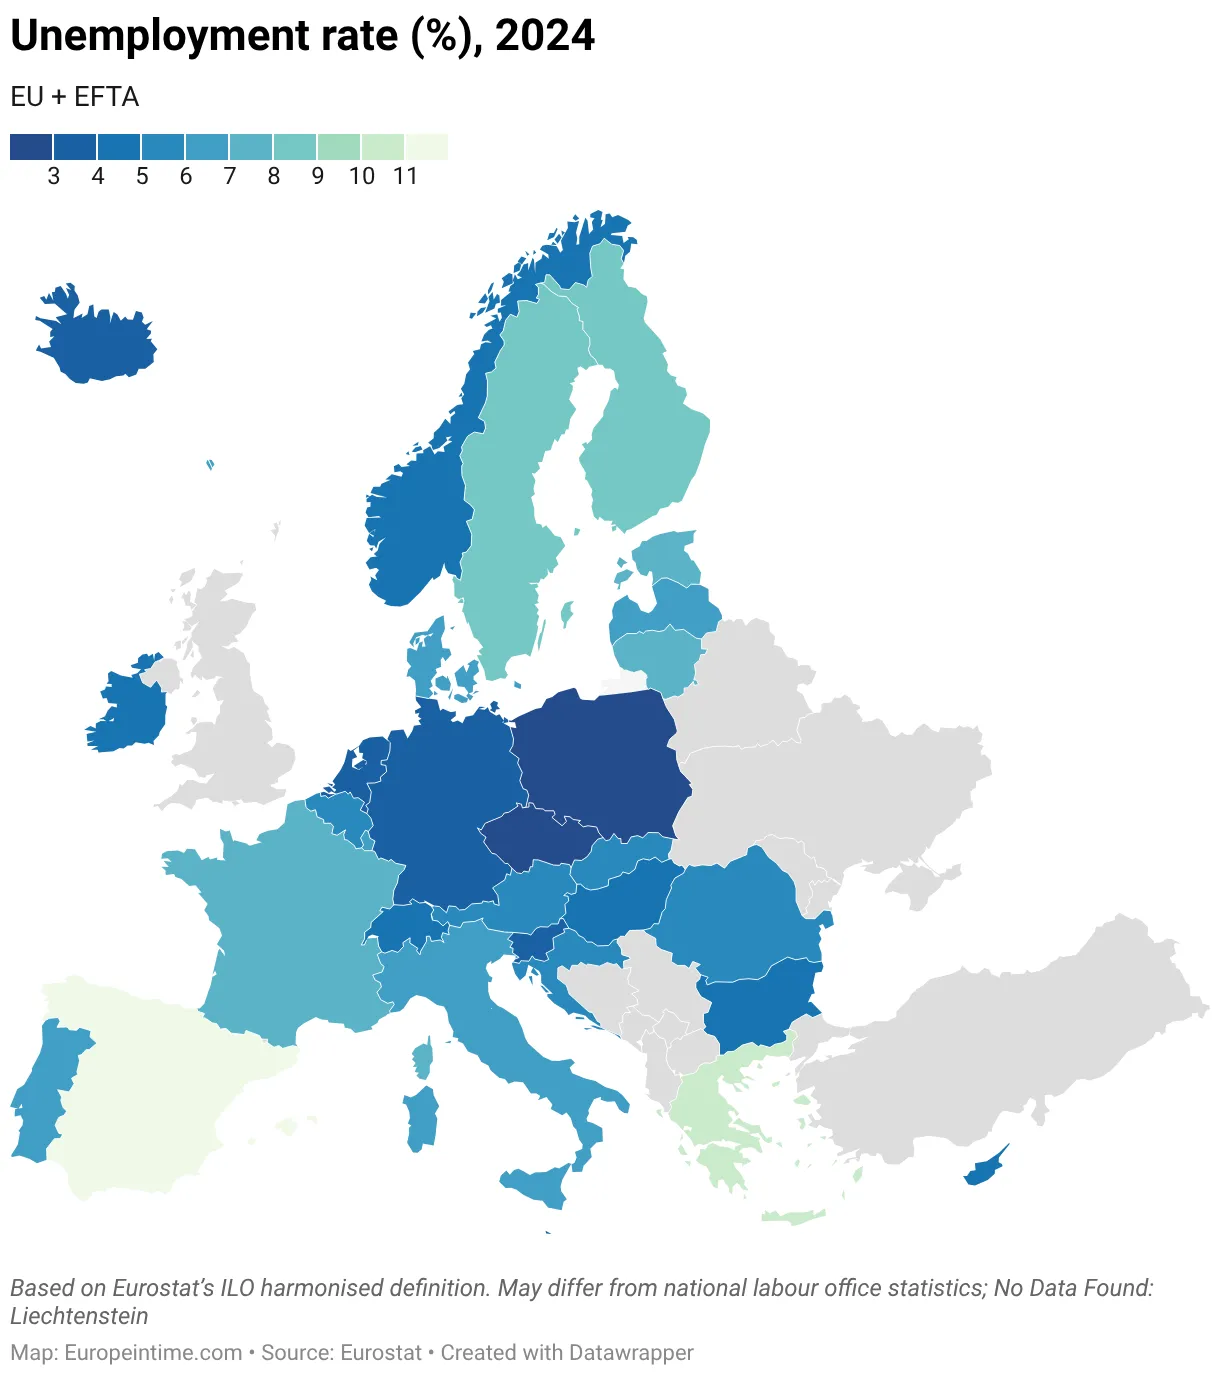
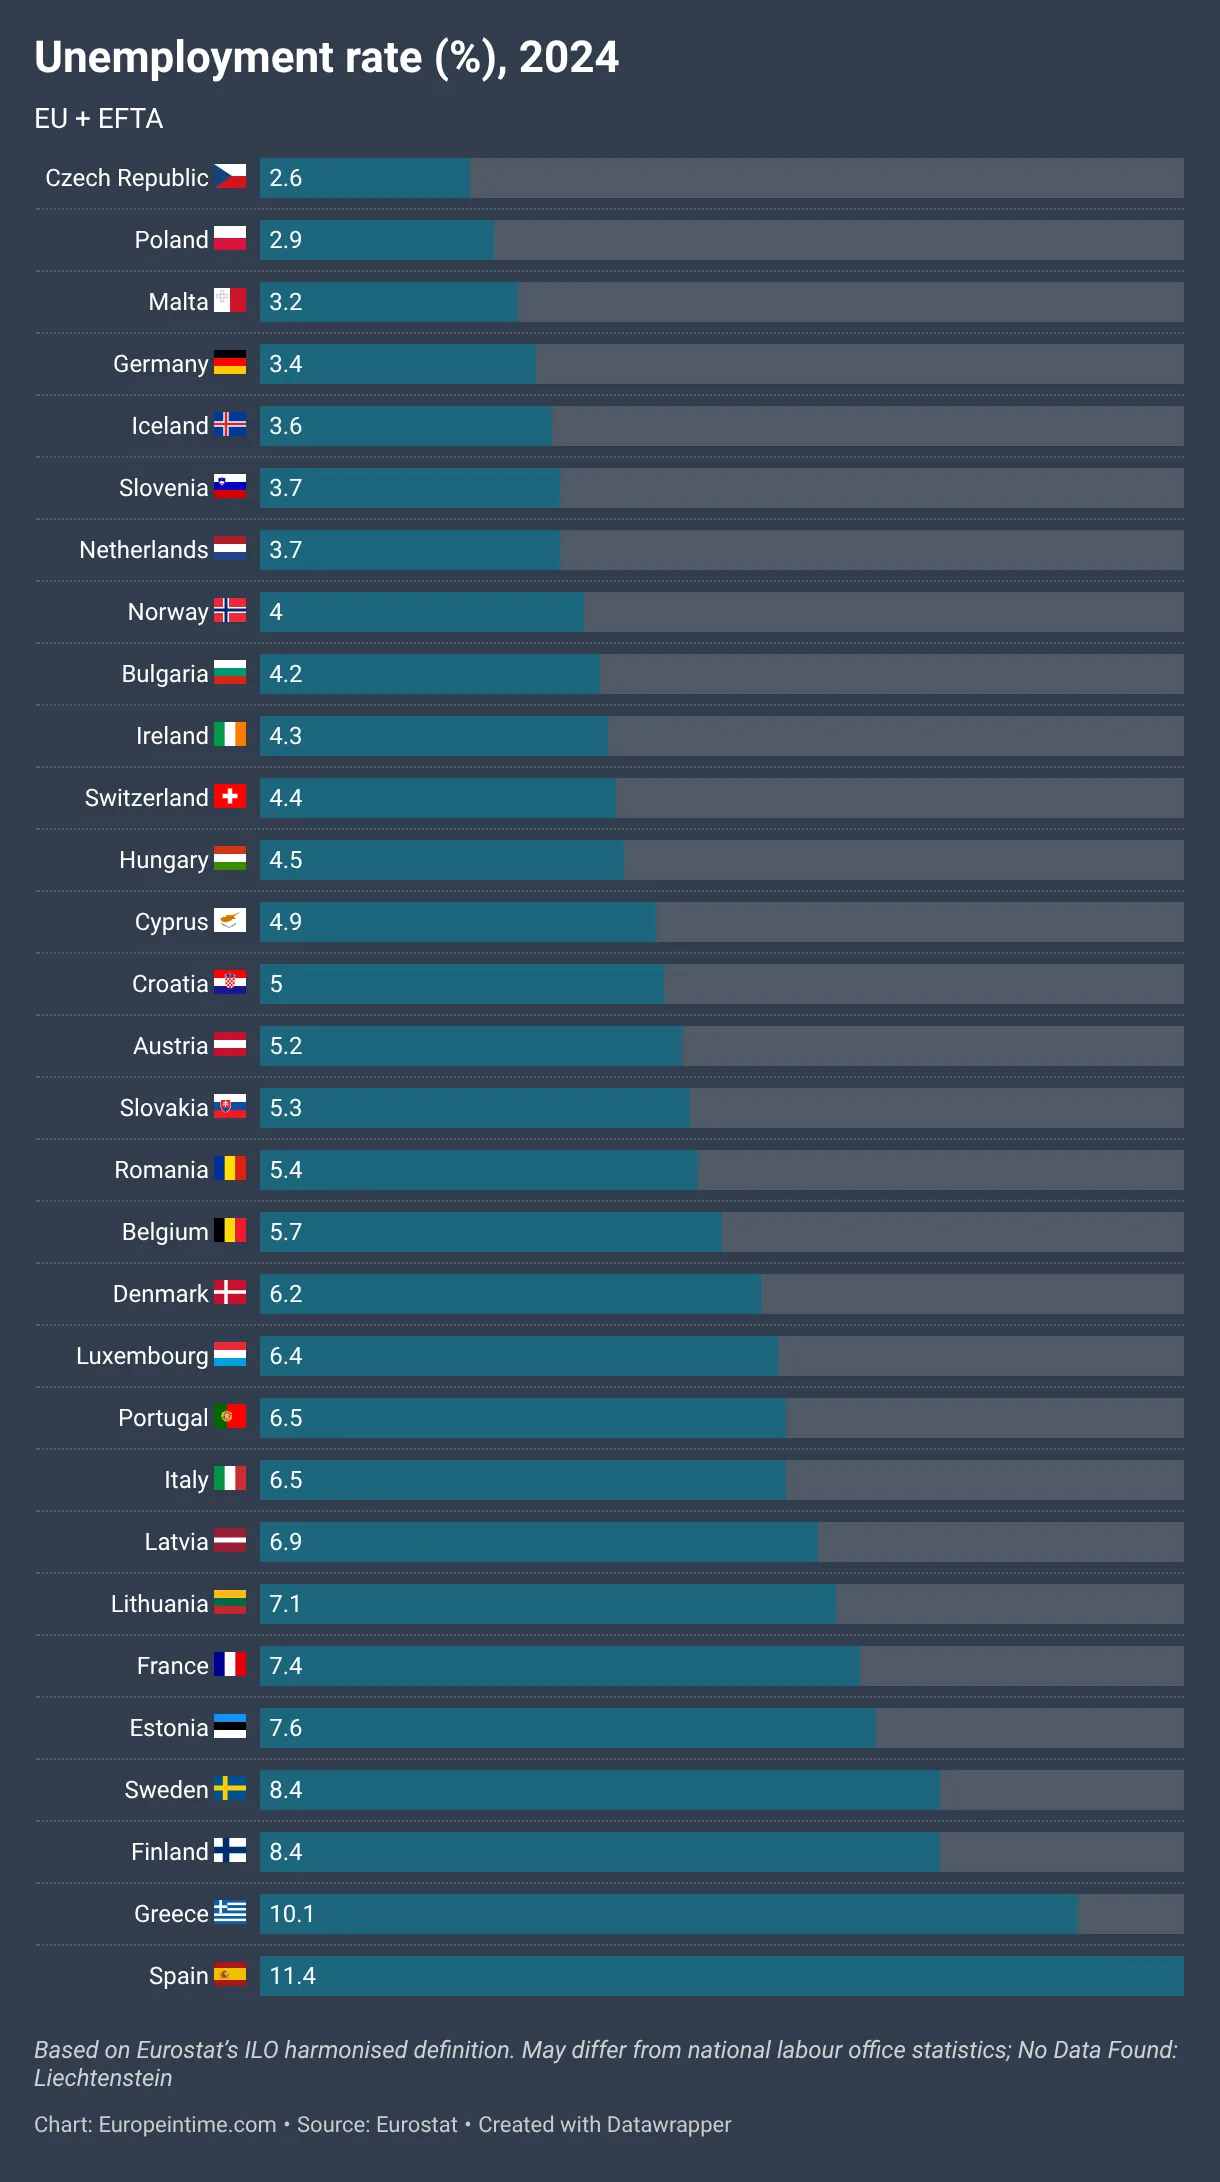
In 2024, unemployment across Europe ranged from 11.4 % in Spain and 10.1 % in Greece to just 2.6 % in the Czech Republic and 2.9 % in Poland. Between these extremes lies a wide spectrum of labour market conditions shaped by economic structure, policy design and demographic trends.
To make the patterns easy to explore, the page offers three complementary views. Current map shows the latest available year. Current table provides exact national values. And time series visualizes the full trajectory since 2010 — revealing crisis spikes, recoveries and long-term volatility.
Extended analysis
1) The post-crisis landscape: persistent gaps across Europe
The early 2010s were marked by elevated unemployment following the global financial crisis and the euro area sovereign debt crisis. In several countries, unemployment exceeded double-digit levels and remained high for multiple years.
Although most countries gradually improved during the mid-2010s, the data shows that labour market convergence has been incomplete. Southern European economies continue to display structurally higher unemployment rates, while Central European countries tend to maintain much lower levels.
2) The 2020 disruption and recovery
A second visible shock appears around 2020. While the magnitude differed across countries, the data reveals temporary increases followed by recovery. In many cases, labour markets stabilized again by 2022–2023.
The speed of normalization varied considerably. Countries with more flexible labour markets or stronger fiscal responses tended to return faster to pre-2020 unemployment levels.
3) 2024 snapshot: highest and lowest unemployment
In the latest year (2024), the highest unemployment rates are observed in: Spain (11.4 %), Greece (10.1 %), Sweden (8.4 %), Finland (8.4 %) and Estonia (7.6 %).
The lowest unemployment rates in 2024 are recorded in: Czech Republic (2.6 %), Poland (2.9 %), Malta (3.2 %), Germany (3.4 %) and Iceland (3.6 %).
This dispersion illustrates the persistent structural diversity of European labour markets.
4) Volatility: which labour markets fluctuate the most?
Beyond levels, volatility reveals how sensitive national labour markets are to economic cycles. Measured by the coefficient of variation (2010–2024), the most volatile unemployment trajectories are observed in: Poland, Czech Republic, Ireland, Hungary and Bulgaria.
In contrast, the most stable labour markets over the period are found in: Switzerland, Sweden, Finland, Austria and Norway.
Low volatility typically indicates structural resilience and diversified economies, while higher volatility suggests stronger cyclical exposure or transitional dynamics.
Archive of maps and tables